Data storytelling examples with public numbers, checked twice
The best data storytelling examples answer one reader's question with one big number, checked on two sources. Colours, icons and animation come later. Here are real examples from public data, with the method behind them: every number on screen has an extraction and a second official page that confirms it, or it does not go out.
Example 1: contracts just under the threshold
For an open data project on Italian public spending: 1,782 public contracts at €139,900 and 7,924 at €39,900, just under the thresholds that allow a direct award. One question (how many contracts stop just short of the threshold?), two numbers, one label. No adjective: the reader draws the conclusion.
Example 2: nurseries still under construction
Prepared for a regional party: 54.1% of recovery-fund nurseries in Lazio still under construction (124 of 229), against 46.0% in Italy. Two bars and a big number. A second, more descriptive version was dropped: too much to read. The chart is drawn by a script from the checked numbers, so it cannot get a comma wrong.
Start from a question, not a topic
"Health spending" is a topic. "How many recovery-fund nurseries in my region are still under construction?" is a question. A good question has an answer in a number, concerns the reader and comes with a natural comparison: the national figure, the year before, the neighbouring region.
What an infographic costs
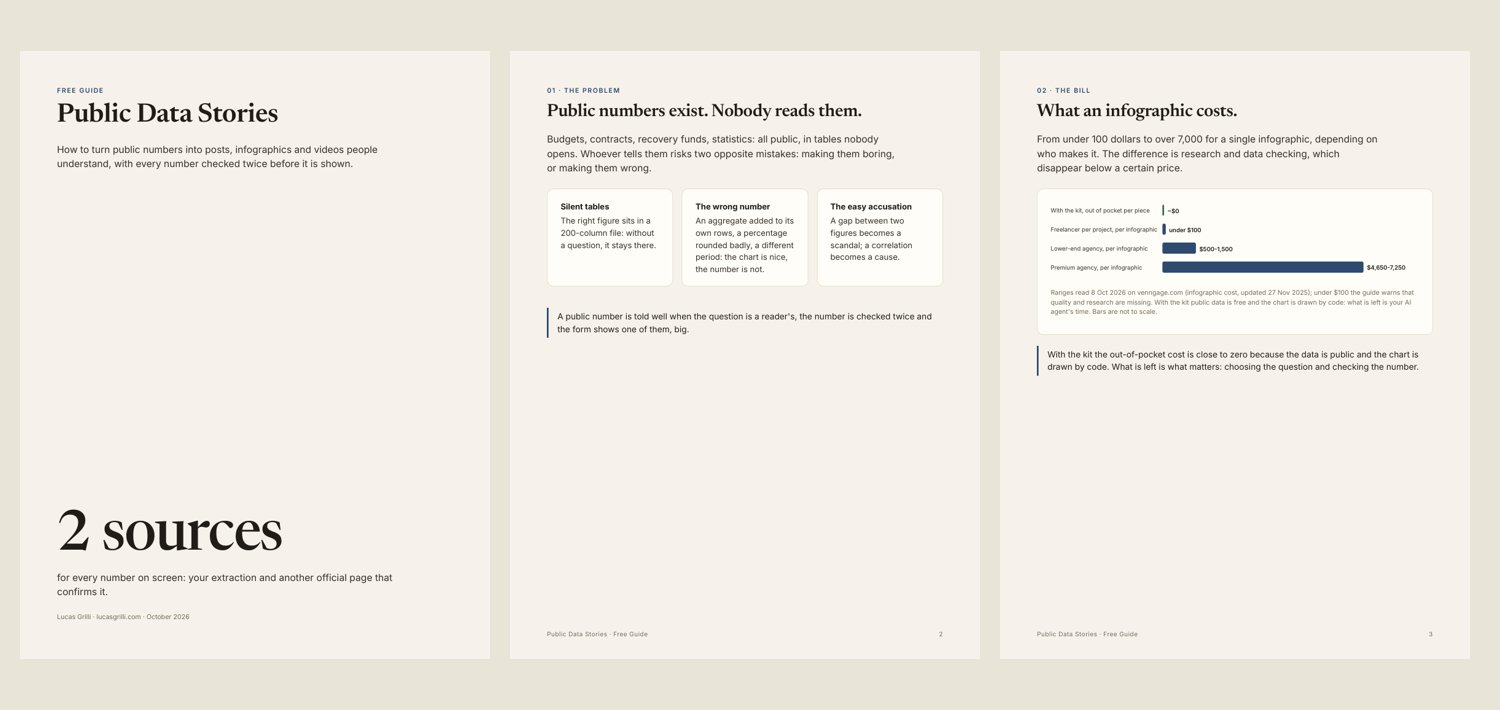
According to Venngage, under $100 from a freelancer per project, where quality and research are often missing; $500 to $1,500 from a lower-end agency; $4,650 to $7,250 from a premium agency. What makes the difference is the research and the checking of the data.
What an infographic costs
The double check behind each example
Check A is your extraction from the dataset: value, unit, period, territory, formula. Check B is another official page showing the same number or perimeter. B confirms elsewhere, it does not redo the calculation: I once downloaded 280 MB of files to redo a count already verified, and that became a rule.
Then a program redoes sums and rounding. In the kit test it blocked three cases built on purpose: a number with no B page, a 54.2% that should have been 54.1 (124 of 229 is 54.15), and parts that made 227 instead of 229.
Forms that work
| Form | When to use it |
|---|---|
| one big number | a single figure that surprises |
| two-bar comparison | us against the average, before against after |
| share of 100 | a part of a total people can picture |
| ranking | regions or towns, with the reader's inside |
The feed wants 4:5, stories and reels 9:16: make both from the same source and keep text out of the bands the app covers. In 9:16 that is the profile at the top, caption and buttons at the bottom and on the right. The estimates I use are 140 pixels at the top, 430 at the bottom, 60 on the left and 130 on the right out of 1080: check them once on a real phone. For videos from the same checked numbers there is the open-source motore-video-ai.
Common mistakes
- adding an aggregate to the rows it already includes;
- comparing different periods or territories without saying so;
- money over years without saying nominal or real;
- turning a gap into an accusation, or a correlation into a cause.
Frequently asked questions
- What is a good data storytelling example?
- One that answers a reader's question with one number, shows a natural comparison and gives source and period on screen. The contracts just under the threshold and the nurseries still under construction are two.
- Where do I find public data?
- In official datasets and reports: budgets, open data portals, national statistics, agency reports. Always save the link and the date you read it.
- How do I check a number?
- Twice, on two different sources: your extraction from the dataset and another official page showing the same number. Then redo sums and rounding.
- Code or a design tool?
- Code does not get numbers wrong and makes two formats from one file; a design tool is freer on design. Either way, check the bands the apps cover before publishing.
Where to start
The free guide, the kit for your AI agent and the service are on the Public Data Stories page.
And a real question: which public number would you like to see told well? Tell me.
Videos, automations and a second brain for people who work with Claude, built in public on lucasgrilli.com and GitHub.